
Enjoy rooting for the underdog? If you took the opportunity to watch some Week 10 action, seven ‘dogs pushed the Vegas money aside to claim a tie or victory last week. You read that correctly, half of the games played last week flipped the moneyline. Over the last two weeks, 46.4% of the games were taken by the longshots. What in the name of Taysom Hill is going on around here? It’s not rushing production. Rushing TD rate and YPC are both up over the last two weeks, compared to the previous eight. If it’s not the ground games, then we know we should be looking at the passing numbers. And that takes us directly to the culprit.
Over the last two weeks, league-wide passing YPA has declined from 7.4 the first eight weeks to 6.9, passer rating from 94.1 to 86.7, and TD rate from 4.74% to 3.74%. The passing TD rate took a cliff dive at a 21% clip. Looking further, the TD-to-INT ratio from the first eight games dropped from 2.14-to-1 down to 1.5-to-1, a 29.8% free fall. A decline in league-wide QB efficiency clearly plays to the benefit of teams without elite signal callers. In fact, the average scoring differential from 2020 to this season (-1.6 PPG) is tied with the decline between the 1969 and 1970 seasons for the most significant decrease in NFL history — since 1922. While significant, keep in mind that the average scoring last season (24.8 PPG) is the highest in league history. And that the average scoring this season (23.2) is the league’s fifth-highest ever. However, we can plainly see that the recent rule alterations toward protecting player’s health are no longer handicapping defenses, as widely believed.
We know rushing efficiency is fine, scoring is down to pre-’20 levels, and that overall passing efficiency has taken a dive. You might be wondering, what exactly is going on with the passing games? In last week’s column, it was reported that a 15.7% decline in throws of 20-or-more yards compared to the first seven weeks had been registered. And that drop in number was accompanied by an 11.7% drop in YPA, 10.4% in completion rate, 25.9% decline in TDs thrown per INT, 32% decrease in TD rate, and 14.7% dip in passer rating. Those numbers did not improve in Week 10. To the extent that the average passer rating (67.9) and TD-to-INT rate (0.75-to-1) on throws of 20-or-more yards declined to season lows. You can see the results for yourself in the chart below:
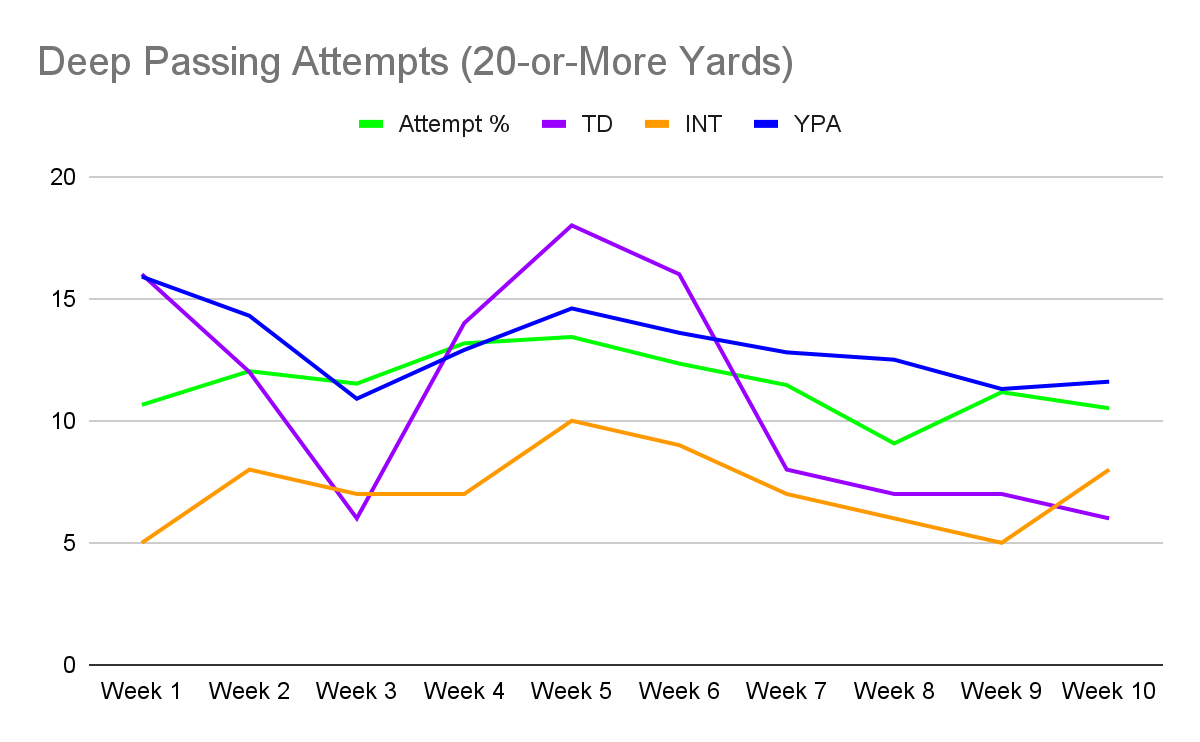
The highlight of Week 5 was an explosion on deep passing with the highest attempt rate of the season (13.43%), and resulting in a season-high of 18 TDs. Dak Prescott, Josh Allen, Justin Herbert, Ben Roethlisberger, Jameis Winston, and Davis Mills each threw for two TDs on 20-plus throws that week. Over the last three weeks combined, 20 TDs have been collected on deep throws. And, as is depressingly depicted by the chart above, the deep passing decline has been on a downward slope for five straight weeks. Assuming the trend continues, in order to take home the top prize in large-field GPPs, there is zero room for error at QB, WR, and TE. Without the ability to count on the most explosive playmakers doing what they do best, we are left with an overreliance on our QBs doing the most damage with their legs, and volume-based results from our receivers. As for the RBs within an assumed air-depression continuance, we should be able to proceed as normal with league averages in our favor.
You’ll see a number of coverage metrics throughout this series. The following chart provides the full names for the acronyms and the average numbers for each position group through Week 10:
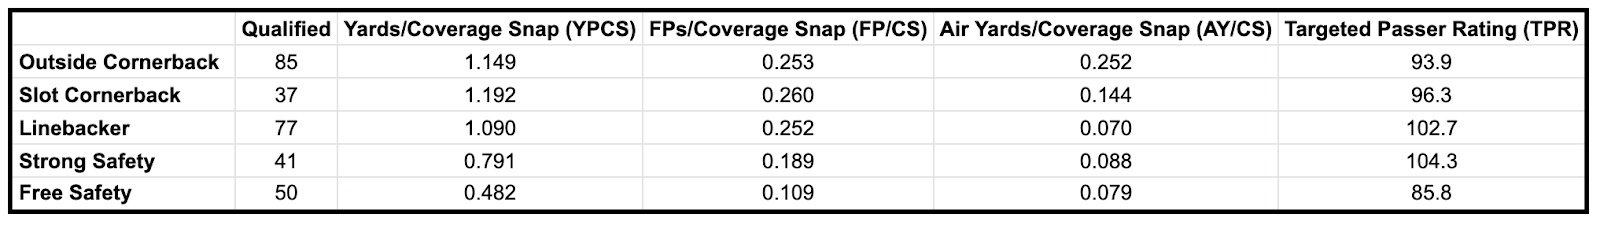
To magnify their importance toward processing the matchup data, familiarity with these abbreviations is key. The full names of the data points in the headers of the data table above will not be written out in full within the specific matchups. You’ll find the following acronyms frequently used whenever referencing defensive coverage statistics:
Yards Allowed Per Coverage Snap = YPCS
Fantasy Points Allowed Per Coverage Snap = FP/CS
Air Yards Allowed Per Coverage Snap = AY/CS
Targeted Passer Rating (i.e., Passer Rating on Targets into Coverage) = TPR
Offensive abbreviations used when referring to QBs/RBs/WRs/TEs:
FPs/Dropback = FP/Db
FPs/Route = FP/Rt
FPs/Touch = FP/Tch
Yards/Route Run = YPRR
Air Yards/Target = AY/Tgt
Yards/Target = YPT
Targeted Passer Rating (i.e., QB Passer Rating When Targeting Receiver) = TPR
If you’d like to learn more about/refresh yourself with each of the defensive coverage shells and other relevant schematic details mentioned throughout this series, utilize the following resources:
Fantasy Shells: Coverage Glossary
Fantasy Shells: Cover 1
Fantasy Shells: Cover 2
Fantasy Shells: Cover 3
Fantasy Shells: Cover 4
One particular alteration of note: now that we are 10 games into the season, the offensive success vs. coverage data utilized will now only date back to Week 1 of the 2019 season — playoffs included, as always. While that is obviously under three years worth of information, I will still refer to the period of time as “the last three years.”
ATS Picks
*36-46 (44%); 2-11 in Week 10 😧>😳>😩>😰>🤮
New England Patriots (-6.5) at Atlanta Falcons
Tennessee Titans (-10.0) vs. Houston Texans
Chicago Bears (+6.0) vs. Baltimore Ravens
Green Bay Packers (-2.5) at Minnesota Vikings
San Francisco 49ers (-6.0) at Jacksonville Jaguars
Cleveland Browns (-10.0) vs. Detroit Lions
Carolina Panthers (-3.5) vs. Washington Football Team
New York Jets (+3.5) vs. Miami Dolphins
Las Vegas Raiders (+1.0) vs. Cincinnati Bengals
Dallas Cowboys (+2.5) at Kansas City Chiefs
Arizona Cardinals (-2.5) at Seattle Seahawks
Tampa Bay Buccaneers (-11.0) vs. New York Giants
Game Totals
*30-34 (47%); 7-3 in Week 10
New England Patriots at Atlanta Falcons (Under 47.0)
Indianapolis Colts at Buffalo Bills (Over 50.5)
Houston Texans at Tennessee Titans (Under 44.5)
Baltimore Ravens at Chicago Bears (Over 45.5)
Green Bay Packers at Minnesota Vikings (Under 49.0)
San Francisco 49ers at Jacksonville Jaguars (Under 45.0)
Washington Football Team at Carolina Panthers (Over 43.0)
Miami Dolphins at New York Jets (Over 45.0)
Cincinnati Bengals at Las Vegas Raiders (Over 49.5)
Dallas Cowboys at Kansas City Chiefs (Under 56.5)
Arizona Cardinals at Seattle Seahawks (Over 48.5)
Pittsburgh Steelers at Los Angeles Chargers (Under 47.0)
Moneyline
*50-31 (62%); 4-9 in Week 10
New England Patriots (-280) at Atlanta Falcons
Tennessee Titans (-450) vs. Houston Texans
Chicago Bears (+205) vs. Baltimore Ravens
Green Bay Packers (-130) at Minnesota Vikings
San Francisco 49ers (-250) at Jacksonville Jaguars
Cleveland Browns (-435) vs. Detroit Lions
Carolina Panthers (-180) vs. Washington Football Team
New York Jets (+155) vs. Miami Dolphins
Las Vegas Raiders (+100) vs. Cincinnati Bengals
Dallas Cowboys (+120) at Kansas City Chiefs
Arizona Cardinals (-125) at Seattle Seahawks
Los Angeles Chargers (-255) vs. Pittsburgh Steelers
Tampa Bay Buccaneers (-550) vs. New York Giants
Matchups to Target
Mac Jones, NE ($5.4K DK | $7.0K FD) vs. Falcons’ Cover 1 | 2 | 3
Only twice in ten games has Mac Jones both thrown for more than 229 yards and multiple TDs. Without anything contributed on the ground, The Joker’s floor is stabilized by efficiency, but ultimately capped. And he is entirely a matchup-based entity. On the surface, the Falcons’ league-high rate of Cover 2 — 34% higher than any other team — would not scream in support of Jones this week. That’s not to indicate it’s a scheme where Jones has struggled, it’s actually the setup where he’s completed his highest rate of attempts (81%). He just doesn’t have the arm strength to properly take advantage of the honey holes down the sidelines that a Cover 2 presents.
But, in each of the last three weeks, Atlanta has fielded a Cover 1 rate among the top-seven teams. Jones has thrown for more TDs against Cover 1 (five) than when inside the red zone (four). Among QBs over the last three years (43 qualified), Jones ranks 14th-best with 0.43 FP/Db against Cover 1. On 29% of rookie dropbacks across from Cover 1, Jones has passed for 34% of his yardage (second-highest), and 38% of his TDs (fourth). His YPA also improves by 17% and air yards/attempt by 26%. The “Dirty Birds” are delivering the second-most pure passing FPG to QBs (18.0), and third-most overall (21.4).
Hunter Henry, NE ($4.5K DK | $5.7K FD) vs. Deion Jones, ATL
Can we really look past a TE that has scored seven TDs in his last seven games? No other TE has even scored six. Hunter Henry is fifth this season with 0.45 FP/Rt. That said, he failed to hit profit above value during the four weeks prior to his Week 10 results. It’s something he’s only managed three times this season. We obviously need to hand-select his matchups.
In two of his three best games this season, the opposing defense put Cover 3 on the field at a top-eight rate. And, over the last three seasons, Henry ranks eighth-best with 0.44 FP/Rt when facing Cover 3. He also ranks first overall with 12.5 YPT, third with 9.86 air yards/target, and third with 2.48 YPRR. Wouldn’t you know it, in the last two games, Atlanta has played Cover 3 at a top-eight rate. Over the last three weeks, Deion Jones has been torched for a combined 18/219/0 line on 22 targets. It accounts for a portion of the Falcons surrendering the eighth-most FPG to TEs during the last four weeks (14.0).
Final notes on New England
Even if Damien Harris ($5.8K/$6.5K) manages to clear the concussion protocol in time for Thursday Night Football, we are going to see a larger role dedicated to Rhamondre Stevenson ($5.6K/$6.5K). Stevenson possesses legitimate RB1 upside. When he’s on the field, the Patriots are a different team. He’s simply too quick for a player his size. Not fast, mind you, but equipped with the footwork to manipulate tackling angles to his benefit. It will be to the deficit of New England if the work isn’t at least distributed evenly between Harris and Stevenson when they take the field together next. Stevenson’s presence also renders Brandon Bolden’s ($4.5K/$5.3K) obsolete.
If knowledge was available that Harris would be out again, Stevenson would not only be written up as a Target, he’d be one of my top-three RBs for Week 11. Atlanta is dealing out the third-most FPG to RBs this season (28.9). Without Harris last week, J.J. Taylor ($4.0K/$4.9K) was used behind Bolden in the passing game. Bolden is dealing with a hip injury. If he and Harris are inactive, Taylor would be an intriguing pivot. Jakobi Meyers ($4.8K/$5.9K) finally scored his first TD. After four games with target shares north of 25% during the first six games, he’s only collected more than 20% once during the last four. However, he will work against a Falcon’s defense attempting to survive without the stellar slot play of Isaiah Oliver. Avery Williams’ coverage numbers do not qualify, but would place at the very bottom of slot CBs if they did.
Kendrick Bourne ($4.7K/$6.0K) has been head-and-shoulders better than Nelson Agholor ($3.6K/$5.2K). On the season, Bourne is averaging 0.43 FP/Rt (22nd-best) vs. 0.24 for Agholor (88th). For as many reps as N’Keal Harry’s ($3.0K/$4.7K) knee can manage, they should come at the expense of Agholor. Why Bourne is seeing less time than Agholor is beyond comprehension. The shoulder injury forcing Jonnu Smith ($2.5K/$4.5K) to miss Week 10 is a bit odd after he participated in each practice session the week prior. Another absence would obviously bolster Henry’s upside. If Smith does take the field, he has been surprisingly efficient with his routes, and wouldn’t be the worst TE punt of Week 11.
Final notes on Atlanta
I owe a sincere apology to Bill Belichick’s defense. Previously questioning the merits behind their status as an elite defense, they proceeded to dismantle the Browns 45-7, and injured Baker Mayfield in the process. They held Cleveland to 3.7 yards/play, one third down conversion, and achieved it while only forcing one turnover. It’s not a promising spot for Matt Ryan ($5.6K/$6.9K). Belichick is using a masterful approach of blending a scheme rotation of Cover 1, 2, and 3 together. But he’s not using any of the three at a consistent rate. That’s precisely why the Patriots are joining the Cardinals on the DO NOT TRUST list.
If Atlanta is without Cordarrelle Patterson ($6.8K/$7.0K) due to his sprained ankle, another blowout could be on deck. If Patterson is out, Mike Davis ($4.3K/$5.3K) could surrender the carry lead to Wayne Gallman Jr. ($4.0K/$5.1K). Not that it’ll matter. New England is limiting opposing RBs to the sixth-fewest pure rushing FPG this season (10.5). Without Patterson, it would be considerably better for Davis to forego the rushing volume in this spot so that he can focus on recapturing his receiving chops. The Pats are accrediting the fifth-most pure receiving FPG to backs (13.9).
Russell Gage ($4.6K/$5.6K), Tajae Sharpe ($3.6K/$5.0K), and Olamide Zaccheaus ($4.3K/$5.3K) are currently playing the majority of the WR reps in the post-Calvin Ridley world. Zaccheaus is only an option if the defense puts a Cover 6 on the field. The Patriots do not. Gage is the better of the three against Cover 2, but Sharpe is superior against both Cover 1 and Cover 3. Short of recommending Sharpe after he face-planted at Dallas, he will at least have history on his side. Kyle Pitts ($5.9K/$6.4K) might be the individual most affected if Patterson is unable to play. Bilichick has a history of eliminating an opponent's top playmaker, and Pitts is easily that for Atlanta.


