
What This Is
- An imperfect analysis of the top 50 (according to Fantasy Points) running backs’ injury risk and physical performance potential using medical research and injury statistics written from a rehabilitation specialist’s point of view.
- A highly-individualized analysis for the 2021 season.I reserve the right to scrap and/or update this list as news trickles out of camps.
What This Isn’t
- An “Injury prediction” article.
- An injury prediction “model.”
- An evaluation of a player's talent and/or overall fantasy potential.
For rankings and projections, I left it to the professionals here at Fantasy Points. My work merely complements theirs. For a bigger picture/zoomed out perspective of how to view NFL injuries, read here and here. Now that’s out of the way, I understand fantasy players want some guidance on the chance of injury and volatility of physical health. Enter this pseudo-scientific attempt at quantifying players’ injury risk. The top 50 veteran running backs going into 2020.
Methods
As mentioned, injury “prediction” is a fool’s errand, especially in football, as just 2.3% of games are injury-free. However, there are basic orthopedic principles and medical statistics that help to estimate the physical health and performance volatility in NFL running backs. For those who remember last year’s articles, this process will look familiar but it’s slightly tweaked for accuracy and brevity:
- The three most common injuries among running backs are to the shoulder, ankle, and hamstring.
- Running routes leads to more concussions than carries do which leads to greater consideration for some pass-catching backs.
- Meniscus surgeries reduce NFL running backs’ games played and snap-share for the first two years after the procedure.
- Running backs with 300+ carries tend to play longer in the NFL, suffer fewer concussions, and miss fewer games the following season compared to backs with 150-250 carries in the previous season (this is an entire conversation on its own… click here if you’re curious).
Quantifying Volatility
The volatility scores can be thought of in two branches: physical performance/athleticism and injury risk. The first branch is best quantified by age since there’s a decline in athleticism with time. To reflect this aging process, each player was assigned 0.25 points for every year they were over the age of 26 (26 is the final year of the average top-12 running back). Additionally, every running back received a score of 1 for the three most common injuries of the position (ankle/hamstring/shoulder) so the baseline score of every player is 3. To further quantify each players’ risk, recurrence data from the medical research on NFL players was utilized if available (recurrence is defined as the percentage of running backs who sustain an injury more than once in a career). If a recurrence rate wasn’t available in the medical literature, it was calculated manually using the injury reports from 2016-2019. For example, about 20% of players coming off an ACL injury miss a game due to complications and is represented by 0.20 in the volatility score. A lateral ankle sprain recurs at 15% and is represented by 0.15 in the score, etc. To represent the fact that every injury is not created equally, a documented concussion within one year is scored as 0.2 due to the recurrence rate in that time frame. If within the last two years, the score is 0.1. Lastly, a player had 0.5 points subtracted from their score if they carried the ball 300+ times in 2019, since historical data shows only 49% of these players miss more than one game due to injury in the following season. For that reason, their counterparts who saw 300+ carries in 2019 were “rewarded” by subtracting 0.50 from their score. Again, this isn’t a perfect process.
A full breakdown of assigned units for each injury/performance factor is in the table below.
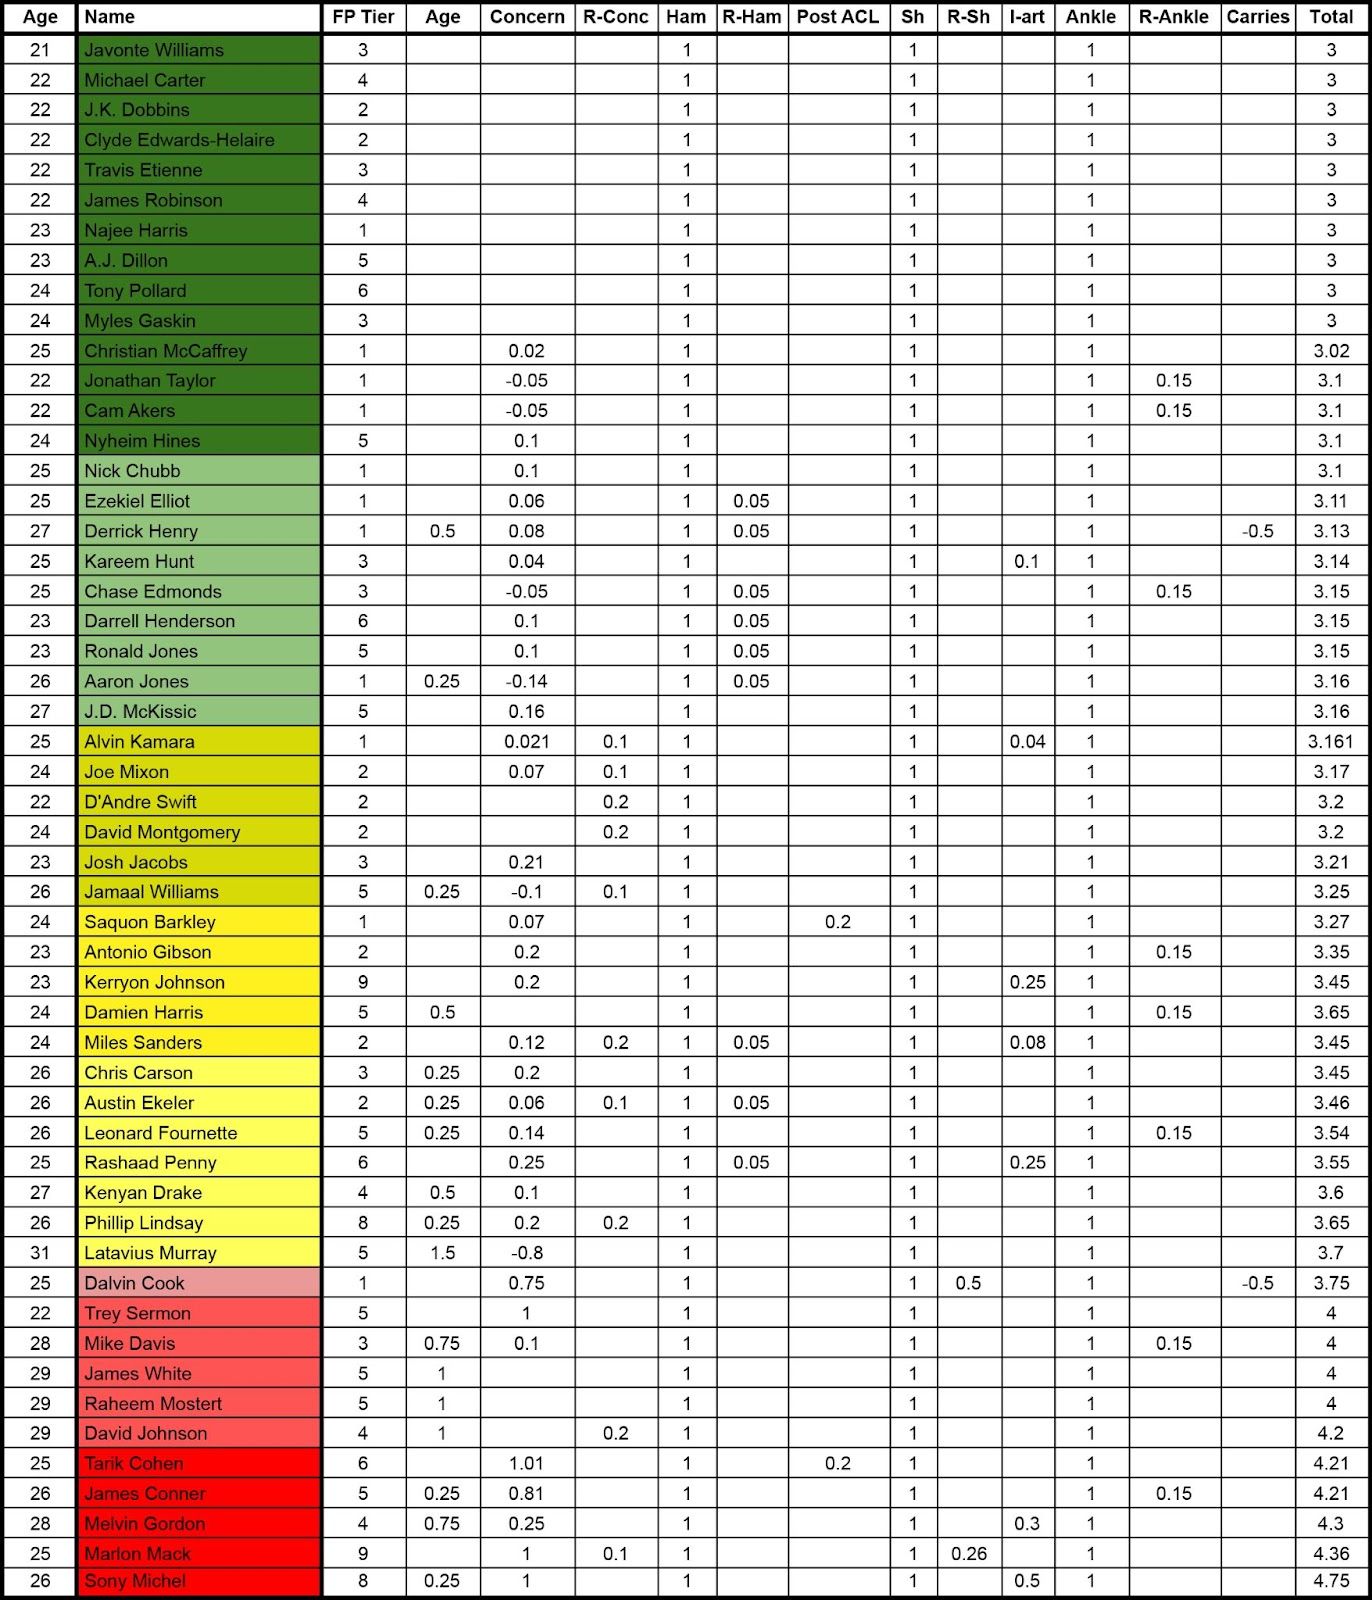
Key
R-Conc: Recurrent concussion, 0.1 or 0.2 Within 2 years or within 1 year
Ham: Hamstring 1 All at baseline
R-Ham: Recurrence of Hamstring Injury 0.05 within one season, Once per player history
Post ACL: 1 year post ACL, 0.2, Once per player history to account for soft tissue/knee injuries
Sh: Shoulder, 1, all at baseline
R-Sh: Recurrent Shoulder, 0.26 or 0.5
I-art: Intra-articular, variable for joint surgery or injury
Ankle:, all at baseline, 1
R-Ankle: Recurrent Ankle, 0.15, once per player history
In situations where quantifiable data seemed absent, minimal, or needed context, “clinical judgment” values were assigned to help “balance out” a raw score that might not be a true reflection of their physical volatility. This value could be positive or negative. This is similar to the idea of raw projections vs. rankings. Admittedly it’s the most important portion of the process but is the most subjective.
The final score represents each player’s physical volatility due to previous injury and overall athletic ceiling. Last year this article helped project the floors of Mark Ingram, Rashaad Penny, Todd Gurley, James Conner, and Sony MichelRB. This is of course not a fool-proof method and can’t predict situations like Ezekiel Elliot, and Christian McCaffrey. There were also players in the “green light” tier who did finish 2020 with minimal injury issues, which represents the fact that the previous injury is the most important variable to reasonably project a player’s future health and availability. Think of this process as being sensitive, like a metal detector. Not specific, like a magnifying glass.
There are obviously several weaknesses to this methodology; but if nothing else, it walks users through how I think of players relative to each other and why. The tiers are split into the traditional “green light,” “yellow light,” and “red light” analogy with a description for each tier. The last thing to keep in mind is that players can move up or down in tiers all summer depending on training camp and verifiable reports of health. Just because a player makes the Red Light tier doesn’t mean they’re undraftable. Similarly, a player in the Green Light Tier isn’t considered invincible. Contact injuries like concussions, high ankle sprains, MCL sprains, AC sprains, contusions, etc all happen. It typically, in a vacuum, isn’t a good predictor of overall durability.
Typically level 1 Green Light tier players are young, haven't accumulated many injuries, have a healthy college track record, or had injuries that don't recur. Some combinations remain true for these players. CMC's 2020 was a reflection of what happens when two of the most common RB injuries (AC joint sprain, high ankle sprain) can wreck a season. After the up and down workloads going from rehab to practice to game twice, what likely happened here is his body and brain short circuited and he suffered a quad strain. These injuries aren't necessarily recurrent in nature and he should be good to go in 2021.
Level 2 Green Lighters have a long track record of healthy, but have sustained some form of collateral damage simply due to playing the sport of football. they're still highly durable but a previous surgery, aging body, or random collections of injuries keep them out of the top tier.
Level 1 Yellow Light tier players this year represent players with a collection of injuries that simply need to be accounted for. They're banged up too often to merit Green Light status due to concussions, multiple sprains, or a combination of the two. Make no mistake these players should still be considered durable, but they do have a history that should be accounted for. In this case, exclusion from the elite durability warrior club above is how to account for their history.
Level 2 Yellow Light Tier is where tangible risk can be quantified. This year a mini tier includes Barkley off an ACL and Gibson who has admitted to continued toe issues stemming back to last year. Further, Kerryon Johnson has a history of knee issues despite finishing all 16 games last year and Miles Sanders has sustained a hodge-podge of injuries since entering the league. There are dozens of unknown factors that even the sharpest managers can't account for. So when injury history and data can account for something like injuries, we should use it to our advantage. Being in this tier doesn't mean it's doom and gloom. Instead, view this as a tie-breaker between another player in a similar tier. However don't ignore that this risk doesn't inherently mean their upside is capped. Although the risk is tangible, it's not worthy of a full blown fade.
This tier is as diverse as it is risky. The dreaded Red Light Tier should be viewed cautiously and balanced against a player's upside. For example, despite getting through 2020 without shoulder issues, there's plenty of medical data pointing to Dalvin Cook's chronic shoulder dislocations since high school being a problem due to recurrence risk. The problem is the massive gap between his talent and upside and his floor. Meanwhile David Johnson, who fell out of the top 12 last season and suffered a concussion, is facing the fact that there have been very few previously top now-aging RBs who fell off then bounced back. Melvin Gordon, with a major knee surgery in his past, is facing a similar performance situation. Marlon Mack and Tarik Cohen are on the very cusp of draft capital and athleticism cutoffs for successful returns after major procedures. Mike Davis is a slightly above average back who has never handled a full workload consistently and is beyond the cliff and could take a dive at any time. ADP data will help you make the decision whether these backs are worth it on draft day.
Conclusion
In the end, football is a violent sport and any player who steps on the field is at risk for injury. However, after looking at the data and utilizing publicly available information, it’s possible to create a reasonable estimate of each players’ risk. Whether due to injury or physical capabilities, players in the Green Light and Yellow Light tier are associated with much less “risk” when it comes to performance in 2020 compared to the Red Light tier.


