
Hoist your sails and get ready to venture through the treacherous waters of auction/salary-cap draft strategy. Today, we are going to map this sea out unlike anything you’ve read or heard about before. Using the power of simulations and wins above replacement (WAR), we’ll chart which strategies produced most of what every fantasy voyager seeks: wins.
It’s hard enough accurately projecting players in rank-order, but auction drafts challenge us to also decipher the degree of separation each player stands from one another. Take Christian McCaffrey’s unprecedented 2019 season for example. He scored more points than any non-QB in the past decade, easily earning himself worthy of the hindsight #1 player in the game. No one would dare question this. But how much was he worth in auction drafts? At what point would the cost paid in an auction draft for McCaffrey have been too much to overcome in constructing the rest of one’s roster? That’s a much harder question. And I think I have the answer.
But that’s not the point of this article (don’t worry, I’ll still answer the question). The point of this article is to evaluate different auction strategies in assembling a starting squad and track how effective these strategies were over the past couple of years. We’ll do this by running thousands of simulations on common auction draft strategies and comparing which strategy provided the most value — in terms of fantasy wins — on average. We will need two key pieces of information in doing so: average draft cost (ADC) as determined by NFFC, and WAR of each player in a given year. Each simulation will randomly select players based on a set of rules to match a particular strategy.
Here are the strategies we’re exploring:
Strategies Simulated
- RB-Heavy (stacking three out of the top-10 RBs by ADC)
- WR-Heavy (stacking three out of the top-10 WRs by ADC)
- Zero-RB (refusing to take an RB who ranks in the top-36 overall, equivalent to the first three rounds of a snake draft)
- Balanced team using RB in flex (players outside of top-12 and within top-60 by ADC)
- Balanced team using WR in flex (players outside of top-12 and within top-60 by ADC)
For each of the five strategies listed above, the following rules governed how each simulation ran. The goal was to develop rules that would result in a realistic fantasy team starting roster construction that could be compared across strategy:
Simulation Process / Rules
Average draft cost (ADC) from NFFC for 2020 and 2019 (only years available) was attached to all player’s end of season WAR output
$200 draft budget with standard starting lineups and seven bench spots
DST/K positions were all assumed to cost $1 each and left out of the simulations
Only the seven starting players remaining in each strategy were simulated. Total spending on all seven starters was between $168 and $178 (leaving $20-$30 for bench assignments and $1 for both DST and K)
Thousands of simulations were run for each strategy
Average total WAR for the seven starters simulated in each set of simulations measured the success of that strategy
Results
Here is how each strategy fared in 2019 and 2020. The base rate tells you what the average WAR for teams operating under no particular strategy. Each strategy displays the difference in average WAR produced compared to the base rate.
| Plus / Minus from Base Rate | ||||||
| YEAR | BASE RATE | BALANCE 3RB | BALANCED 3 WR | TOP RB | ZERO RB | TOP WR |
| 2020 | 6.88 | +0.75 | +0.54 | +0.50 | +0.35 | -0.10 |
| 2019 | 2.11 | +0.60 | +0.57 | -0.02 | -0.03 | -0.29 |
You’ll notice the base rate in 2020 is drastically higher than in 2019. This was due to an update in the WAR model in 2020. But the key is the rank-order of each strategy — which stays consistent in both years. This provides some evidence that we can expect a similar result in 2021 — thus identifying which strategy is the best bet when doling out draft capital:
Strategy Rank (2019 & 2020)
- Balanced 3RB
- Balanced 3WR
- Top-10 RBs
- Zero-RB
- Top-10 WRs
Let’s explore each strategy a little bit more to get a better feel for each option and to provide a better glimpse at what these simulations looked like.
Balanced 3RB
Balancing a team (as defined above) with three starting RBs was the winner in both 2019 and 2020. In this strategy, all players drafted cost between $13 and $38. Ultimately, the data suggests this is the primary strategy you should employ. Here are a few examples of simulated starting rosters under this strategy in 2020:
| Simulation | Position | Player | ADC | WAR | WAR Total |
| 1 | WR | Chris Godwin | 34 | 0.49 | 6.63 |
| WR | Tyler Lockett | 18 | 0.66 | ||
| RB | Jonathan Taylor | 22 | 1.58 | ||
| RB | Todd Gurley | 22 | 0.7 | ||
| RB | Aaron Jones | 36 | 2.01 | ||
| TE | Zach Ertz | 15 | -0.22 | ||
| QB | Lamar Jackson | 23 | 1.41 | ||
| 2 | WR | Mike Evans | 26 | 1.14 | 9.55 |
| WR | Chris Godwin | 34 | 0.49 | ||
| RB | Chris Carson | 22 | 1.35 | ||
| RB | Melvin Gordon | 22 | 0.99 | ||
| RB | Raheem Mostert | 14 | 0.53 | ||
| TE | Travis Kelce | 29 | 2.79 | ||
| QB | Patrick Mahomes | 26 | 2.26 | ||
| 3 | WR | Robert Woods | 24 | 0.95 | 7.82 |
| WR | Adam Thielen | 26 | 1.36 | ||
| RB | David Johnson | 25 | 1.05 | ||
| RB | Melvin Gordon | 22 | 0.99 | ||
| RB | Chris Carson | 22 | 1.35 | ||
| TE | George Kittle | 26 | 0.71 | ||
| QB | Lamar Jackson | 23 | 1.41 |
One thing to note about this strategy is that since the simulation rules only selected players drafted within Round 2 and Round 5, only the top-two ADC QBs qualified. This means that about half the simulated teams choose either Patrick Mahomes or Lamar Jackson. A similar situation occurred at TE, as only the top-four ADC were included in the pool.
The data suggest that being bullish on a top-QB and top-TE in an auction format might be the ideal route to take while scooping up second-tier RBs and WRs. Keep in mind though: this strategy does have risk in floundering if the top few ADC QBs or TEs fail to maintain the level of success from the past couple of years. Given the ultimate consistency of Travis Kelce, there’s no earthly reason to presume this will happen at TE. QB remains a bit more questionable but less so than before in today’s age of the Konami QBs.
To fully understand why this strategy won out in the simulations we need to place a story underlying the data. Top RBs and WRs are the most sought-after fantasy assets. In snake drafts, there’s no way to overvalue the top names because they only cost one draft pick. But in auction drafts, you could technically pay over $180 on a single player if you wanted to and spend $1 on every other selection. The trick is figuring out when the value added runs out on a top name. As the data suggests, top WRs seemed to be the most overvalued by the market as a team with three top-10 WRs performed below base rate. On the other hand, top-loaded RB squads outperformed base rate — but still wasn’t quite as optimal as this more balanced approach.
Balanced 3WR
Of course, in any auction draft you need to be ready to pivot based on the market of your league. The next best strategy in both the past two years was a balanced starting roster using a WR in the flex (as opposed to RB). The concept of this strategy is basically the same as the last, but there does seem to be some EV in using the scarcer RB position vs WR as the flex. But if your draft seems to be going in on RBs, a third WR might be a decent pivot option. Here are a few simulation examples with this strategy from 2020:
| Simulation | Position | Player | ADC | WAR | WAR Total |
| 1 | WR | Kenny Golladay | 29 | 0.33 | 7.23 |
| WR | DK Metcalf | 21 | 1.48 | ||
| WR | Terry McLaurin | 21 | 0.63 | ||
| RB | Todd Gurley | 22 | 0.7 | ||
| RB | Austin Ekeler | 36 | 0.98 | ||
| TE | Mark Andrews | 18 | 0.85 | ||
| QB | Patrick Mahomes | 26 | 2.26 | ||
| 2 | WR | Keenan Allen | 18 | 1.13 | 7.51 |
| WR | Tyler Boyd | 14 | 0.52 | ||
| WR | DJ Moore | 27 | 0.61 | ||
| RB | Austin Ekeler | 36 | 0.98 | ||
| RB | Aaron Jones | 36 | 2.01 | ||
| TE | Mark Andrews | 18 | 0.85 | ||
| QB | Lamar Jackson | 23 | 1.41 | ||
| 3 | WR | Kenny Golladay | 29 | 0.33 | 7.14 |
| WR | DJ Moore | 27 | 0.61 | ||
| WR | Adam Thielen | 26 | 1.36 | ||
| RB | Kareem Hunt | 16 | 1.41 | ||
| RB | Leonard Fournette | 19 | 0.46 | ||
| TE | George Kittle | 26 | 0.71 | ||
| QB | Patrick Mahomes | 26 | 2.26 |
3 Top-10 RBs
Given what we know about how effective a top-RB can be for a fantasy team, I was a bit surprised that selling out on 3RBs wasn’t the top strategy. But it seems that the market’s desire to price up the best at this position was a bit too much of a burden on the rest of a team to overtake the balanced options listed above. Again, a few 2020 simulation examples:
| Simulation | Player | Position | ADC | WAR | Total WAR |
| 1 | RB | Ezekiel Elliott | 53 | 1.36 | 7.28 |
| RB | Alvin Kamara | 50 | 3.57 | ||
| RB | Joe Mixon | 40 | 0.69 | ||
| WR | Julian Edelman | 9 | -0.19 | ||
| WR | Will Fuller | 13 | 1.03 | ||
| TE | Mike Gesicki | 4 | 0.64 | ||
| QB | Drew Brees | 4 | 0.18 | ||
| 2 | RB | Saquon Barkley | 40 | -0.05 | 4.99 |
| RB | Derrick Henry | 45 | 2.91 | ||
| RB | Clyde Edwards-Helaire | 43 | 1.04 | ||
| WR | Will Fuller | 9 | 1.03 | ||
| WR | Sterling Shepard | 26 | -0.07 | ||
| TE | Evan Engram | 4 | 0.07 | ||
| QB | Carson Wentz | 10 | 0.06 | ||
| 3 | RB | Joe Mixon | 40 | 0.69 | 5.37 |
| RB | Josh Jacobs | 39 | 1.49 | ||
| RB | Ezekiel Elliott | 53 | 1.36 | ||
| WR | Amari Cooper | 23 | 0.76 | ||
| WR | Anthony Miller | 4 | -0.88 | ||
| TE | Darren Waller | 10 | 1.67 | ||
| QB | Matt Ryan | 5 | 0.28 |
Teams under this strategy are left scraping the bottom of the barrel at WR2 and QB, which hurts fantasy teams just a bit more than those top-named RBs help. The fact that Christian McCaffrey and Saquon Barkley both fell to injury certainly impeded this strategy – but that’s the risk you take selling out on RBs and must be accounted for.
Zero-RB
Passing on all RBs with a R3 or better ADC proved to be the wrong approach on average in auction drafts. While those at the very top of the RB ADC list might be overvalued, we now know the second or third tier guys brought value. Here is a glimpse of a few Zero-RB teams from 2020:
| Simulation | Position | Player | ADC | WAR | WAR Total |
| 1 | WR | JuJu Smith-Schuster | 25 | 0.53 | 7.1 |
| WR | DeAndre Hopkins | 36 | 1.49 | ||
| WR | Chris Godwin | 34 | 0.49 | ||
| TE | TJ Hockenson | 3 | 0.64 | ||
| QB | Patrick Mahomes | 26 | 2.26 | ||
| RB | Todd Gurley | 22 | 0.7 | ||
| RB | Melvin Gordon | 22 | 0.99 | ||
| 2 | WR | Julio Jones | 38 | 0.63 | 4.79 |
| WR | Allen Robinson | 27 | 1.17 | ||
| WR | Odell Beckham | 27 | 0.28 | ||
| TE | Evan Engram | 8 | 0.07 | ||
| QB | Patrick Mahomes | 26 | 2.26 | ||
| RB | Todd Gurley | 22 | 0.7 | ||
| RB | Le’Veon Bell | 21 | -0.32 | ||
| 3 | WR | AJ Brown | 21 | 1.04 | 9.63 |
| WR | Tyreek Hill | 37 | 2.35 | ||
| WR | Michael Thomas | 48 | -0.04 | ||
| TE | George Kittle | 26 | 0.71 | ||
| QB | Kyler Murray | 10 | 2.28 | ||
| RB | Kareem Hunt | 16 | 1.41 | ||
| RB | David Montgomery | 13 | 1.88 |
The examples above show a team representing about the average of what we can expect from a team constructed with Zero-RB along with a low performing and high performing simulation. All in all, the odds were less favorable of fielding a more productive team than those listed above.
3 Top-10 WRs
The least successful strategy in both years was one selling out on top-named WRs. Given the sheer amount of decent WR options available, funds were better served being used in other positions as demonstrated by the strategies above.
| Simulation | Position | Player | ADC | WAR | WAR Total |
| 1 | RB | Devin Singletary | 11 | 0.13 | 7.72 |
| RB | Miles Sanders | 40 | 1.13 | ||
| WR | Davante Adams | 40 | 2.74 | ||
| WR | Allen Robinson | 27 | 1.17 | ||
| WR | Chris Godwin | 34 | 0.49 | ||
| TE | Zach Ertz | 15 | -0.22 | ||
| QB | Kyler Murray | 10 | 2.28 | ||
| 2 | RB | Chase Edmonds | 4 | 0.41 | 6.65 |
| RB | Clyde Edwards-Helaire | 43 | 1.04 | ||
| WR | Odell Beckham | 27 | 0.28 | ||
| WR | Julio Jones | 38 | 0.63 | ||
| WR | Davante Adams | 40 | 2.74 | ||
| TE | Mike Gesicki | 4 | 0.64 | ||
| QB | Dak Prescott | 12 | 0.91 | ||
| 3 | RB | Mark Ingram | 13 | -0.4 | 4.41 |
| RB | Cam Akers | 18 | 0.2 | ||
| WR | Michael Thomas | 48 | -0.04 | ||
| WR | Julio Jones | 38 | 0.63 | ||
| WR | Allen Robinson | 27 | 1.17 | ||
| TE | Travis Kelce | 29 | 2.79 | ||
| QB | Carson Wentz | 4 | 0.06 |
The overall message these simulations can teach us is that auction markets have been slightly overvaluing top RBs, but definitely overvaluing top WRs. On the other hand, top TEs (mainly Travis Kelce) have been severely undervalued and top QBs have been undervalued as well. While all auction drafts are different, the simulations suggest taking a more balanced approach in filling out your starting squad with the presumption of leaving some cash for the bench reserves.
2019 Christian McCaffrey
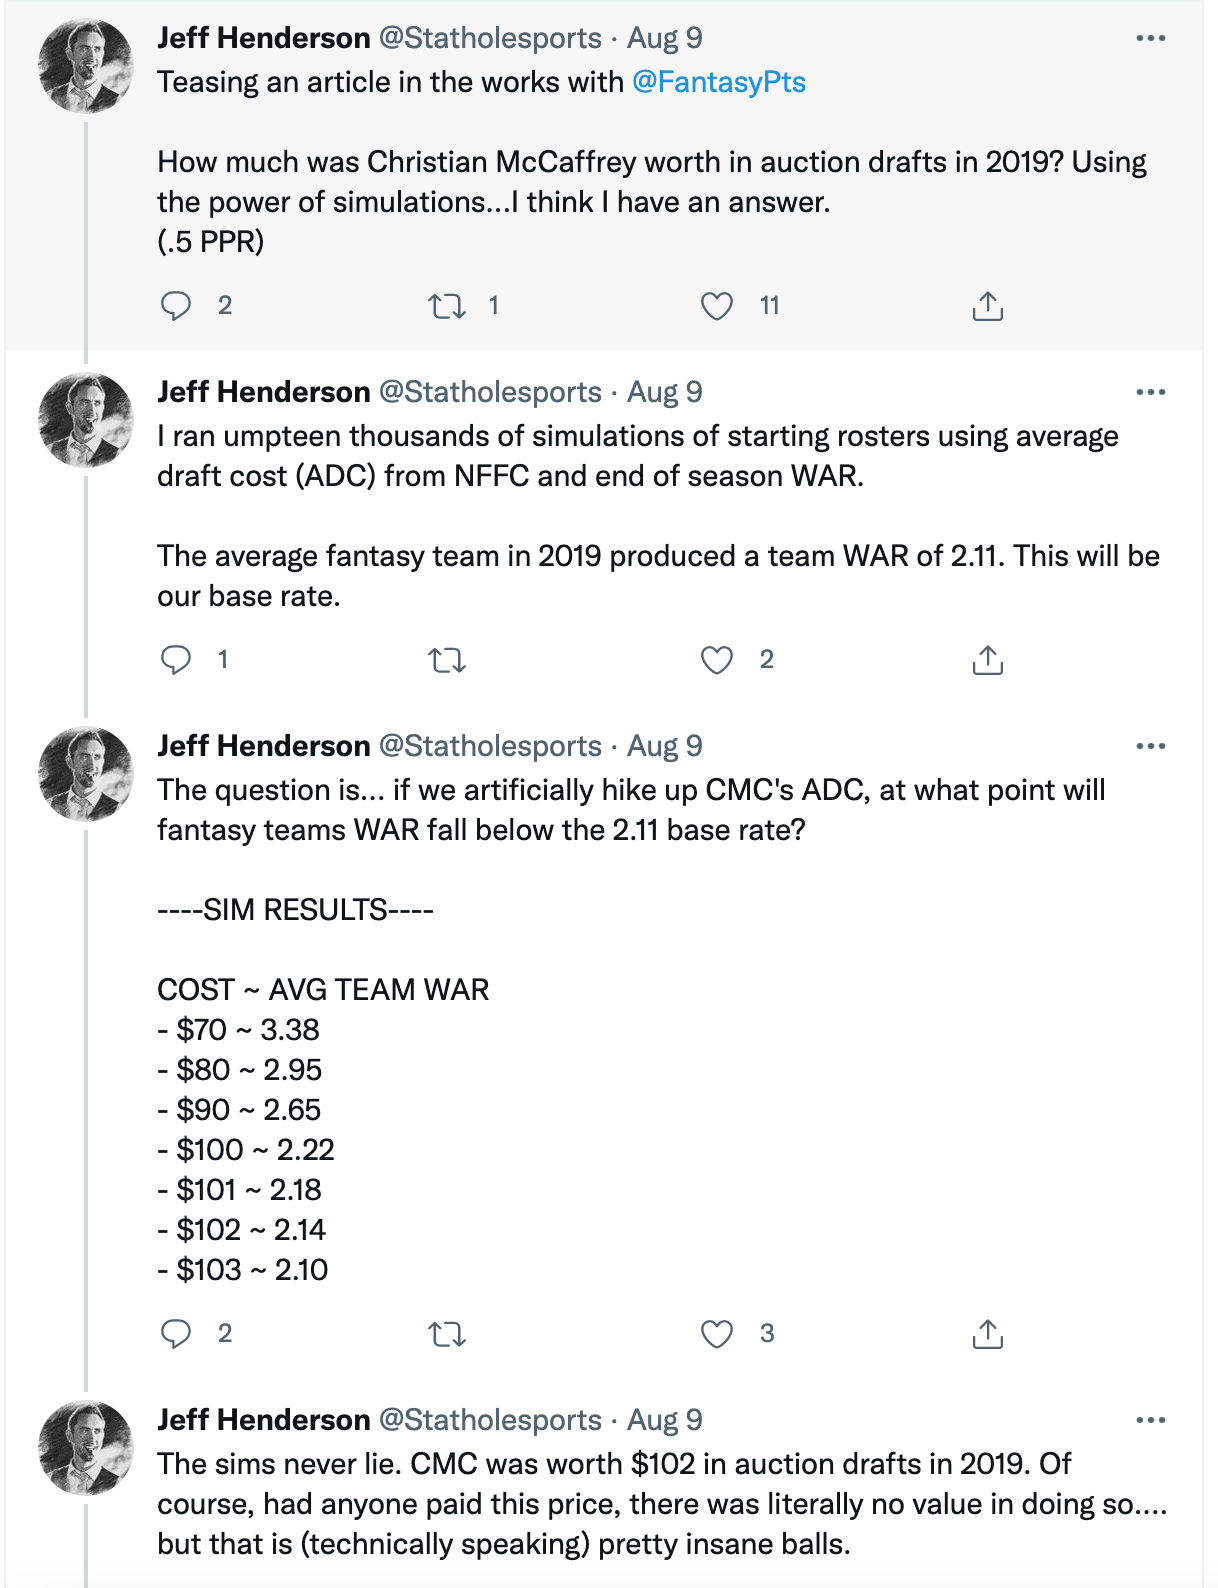
OK, I still owe you an answer on this. To find out what a fair price for McCaffrey was in 2019 given his otherworldly production, I ran thousands more simulations in which he was one of the RBs. Teams with McCaffrey averaged a WAR of 3.73. Given the base rate of 2.11 WAR for 2019, to find out how much value he brought teams, I overwrote his ADC to higher costs — forcing the simulations to assemble the rest of the starting squads with less capital — and kept doing this until I found a price that just barely outperformed the base rate. That figure was
$102.
McCaffrey is going for $58 in NFFC and $72 in FantasyPros for 2021. While this analysis suggests not overpaying for top players, McCaffrey might just be a different animal. Of course, even if he stays healthy this year, it would be unwise to count on him repeating his 2019 output. But even with some regression, you can still feel good about taking him around the $70 mark and returning value.
TL;DR
The best auction draft teams selected starting players between $13 and $38, often times taking a top-tier TE and QB and starting a RB in the flex
Avoid spending big money on top-named WRs
Christian McCaffrey was worth 102 freaking dollars in 2019


